kdump: Capturing and Analysing Linux Kernel Crash Dumps
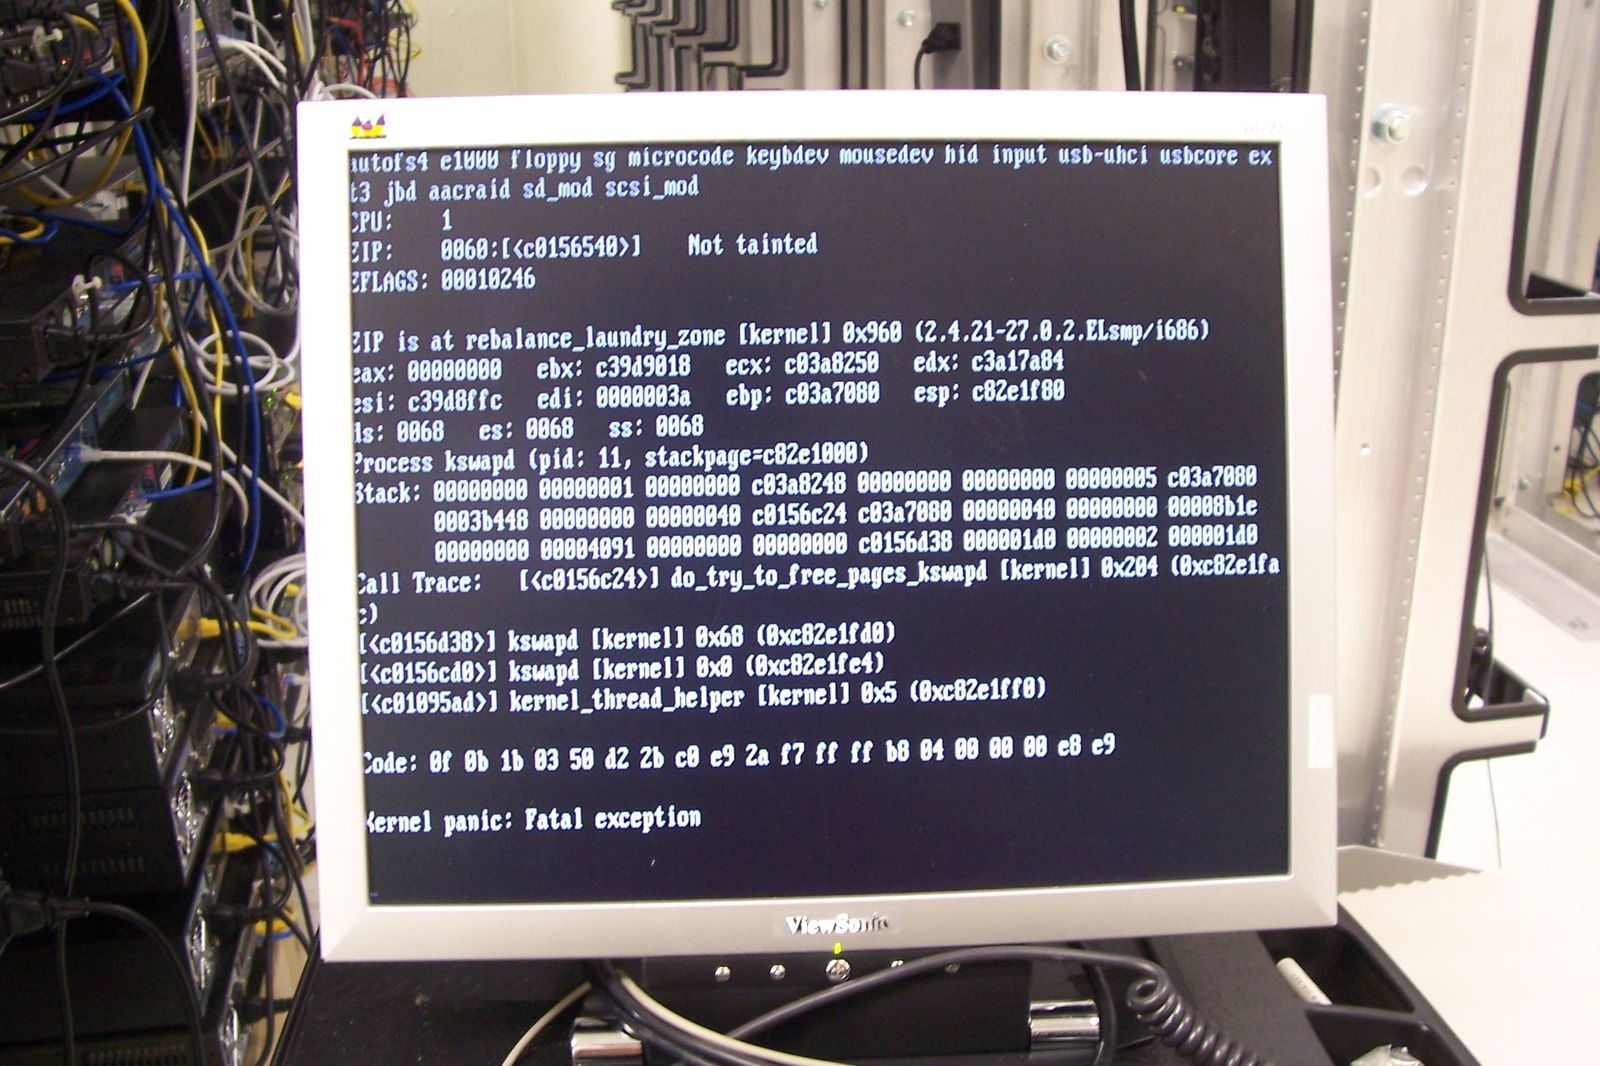
coredumpctl and gdb are for userspace programs that crash. When the kernel itself panics, the whole machine goes down before any of that tooling gets a chance to run. kdump solves this by booting a second, minimal kernel in a reserved slice of memory the instant a panic happens, just long enough to write out a full memory dump you can analyse afterward.
How kdump Differs from Userspace Crash Handling
A kernel panic can’t be caught by the kernel that’s panicking — there’s no safe stack left to run cleanup code on. kdump works around this with kexec: it boots a second “capture” kernel that was never affected by the crash.
1
2
3
4
# Confirm kexec support is compiled into the running kernel
grep -i kexec /boot/config-$(uname -r)
# CONFIG_KEXEC=y
# CONFIG_KEXEC_CORE=y
Tip: kdump captures kernel-space crashes (panics, oopses that escalate). A userspace segfault still goes through the normal core_pattern / coredumpctl path covered separately — the two systems don’t overlap.
Installing kdump Tooling
Package names differ by distribution family, but both ship the same underlying kexec + crash-kernel mechanism.
1
2
3
4
5
sudo apt install kdump-tools kexec-tools    # Debian/Ubuntu
sudo dnf install kexec-tools kdump          # RHEL/CentOS/Fedora

# RHEL/Fedora service name
systemctl status kdump
Tip: On Ubuntu, apt install kdump-tools prompts you during install to enable kdump by default — say yes, then come back and tune the crashkernel size below.
Reserving Memory for the Capture Kernel
The capture kernel needs its own slice of RAM, reserved at boot time before the main kernel can touch it, via a crashkernel= parameter on the kernel command line.
1
2
3
4
5
6
7
8
9
# Check current reservation
cat /sys/kernel/kexec_crash_size
# 0   <- not yet reserved, needs a reboot after changing GRUB

# Add the reservation via GRUB (example: 256 MB, auto-scaling guidance in distro docs)
sudo grubby --update-kernel=ALL --args="crashkernel=256M"
# or edit /etc/default/grub's GRUB_CMDLINE_LINUX and run update-grub

sudo update-grub && sudo reboot
Tip: Undersizing crashkernel= is the most common reason a dump silently fails to capture. 256M is a reasonable starting point for a few GB of RAM; larger memory systems (dozens to hundreds of GB) typically need crashkernel=auto or an explicit larger value per the distro’s sizing guidance.
Enabling and Verifying the Service
With memory reserved and the machine rebooted, the kdump service itself needs to be running and configured with where to write the dump.
1
2
3
4
5
6
7
sudo systemctl enable --now kdump

# Confirm the crash kernel is actually loaded
sudo systemctl status kdump
# Active: active (exited)
cat /sys/kernel/kexec_crash_loaded
# 1
Tip: kexec_crash_loaded must read 1. If it’s 0 after enabling the service, the crash kernel failed to load — check journalctl -u kdump for the reason, usually an undersized reservation or a missing initramfs for the capture kernel.
Choosing Where Dumps Land
By default, vmcore files are written locally, but on a machine that might not be bootable to retrieve them from, a remote target is safer.
1
2
3
4
5
6
7
8
# /etc/kdump.conf (RHEL/Fedora) - local path
path /var/crash

# Or dump over the network via NFS/SSH
# ssh user@dumphost
# path /var/crash

sudo systemctl restart kdump
Tip: If the panic was caused by local storage going bad, writing the dump to that same local storage may simply fail. For disk-related instability, a network target is worth the extra setup.
Forcing a Test Panic
Trusting a crash-capture pipeline you’ve never actually tested is a bad idea — the only way to know it works is to trigger a controlled panic and check the result.
1
2
3
4
# NEVER run this on a production system — only on a dedicated test VM/machine
echo 1 | sudo tee /proc/sys/kernel/sysrq
echo c | sudo tee /proc/sysrq-trigger
# Machine immediately panics and should reboot into the capture kernel
Tip: sysrq-trigger c deliberately crashes the running kernel with no warning and no clean shutdown of any running service. Only ever run this against a disposable test VM, never anything with real workloads on it.
Where the Dump Lands
After the capture kernel finishes writing the core and reboots into the normal kernel, the dump is waiting in a timestamped directory.
1
2
3
4
5
ls /var/crash/
# 127.0.0.1-2012-12-20-03:14:22/

ls /var/crash/127.0.0.1-2012-12-20-03:14:22/
# vmcore  vmcore-dmesg.txt
Tip: vmcore-dmesg.txt alone is often enough to diagnose common panics — it’s the kernel ring buffer at the moment of the crash, readable in a text editor without any special tooling.
Analysing the vmcore
For anything beyond what the dmesg excerpt shows, the crash utility lets you walk the kernel’s data structures at the moment of the panic, much like gdb does for a userspace core.
1
2
3
4
5
6
7
8
9
sudo apt install crash

crash /usr/lib/debug/boot/vmlinux-$(uname -r) /var/crash/*/vmcore
crash> bt
# PID: 0      TASK: ffff8b2a...  CPU: 2   COMMAND: "swapper/2"
#  #0 [ffffb...] machine_kexec at ffffffff...
#  #1 [ffffb...] __crash_kexec at ffffffff...
#  #2 [ffffb...] panic at ffffffff...
#  #3 [ffffb...] oops_end at ffffffff...
Tip: crash needs a debug-symbol-matched vmlinux for the exact running kernel version — a mismatched one will load but give you garbage or missing symbols. Install your distro’s kernel-debuginfo (or equivalent) package for the specific kernel that panicked, not just whatever is currently installed.
Reading the Backtrace
The goal of a basic triage pass is just to find which function was executing when things went wrong, and whether it points at a specific driver or subsystem.
1
2
3
4
5
crash> bt -a
# finds the backtrace was deep inside a specific NIC driver's interrupt handler

crash> log | tail -30
# shows the same oops text as vmcore-dmesg.txt, from within the crash shell
Tip: A crash consistently inside the same driver or module across multiple panics points at that specific piece of hardware or its driver, not the kernel core — worth checking for a firmware or driver update before escalating further.